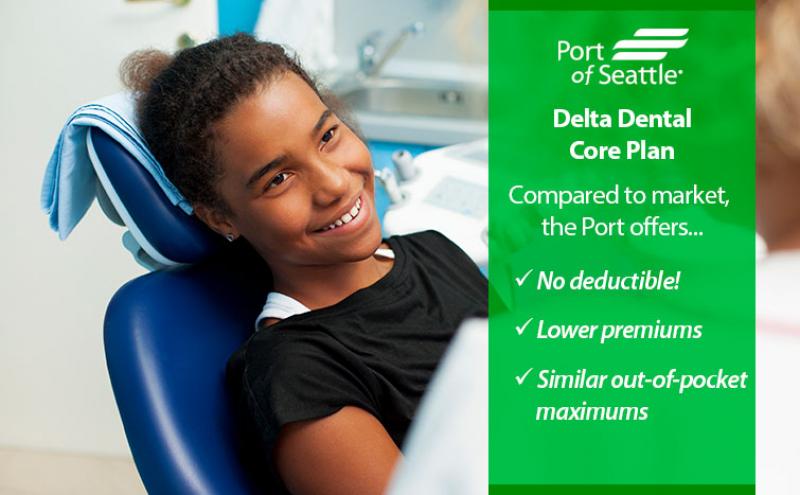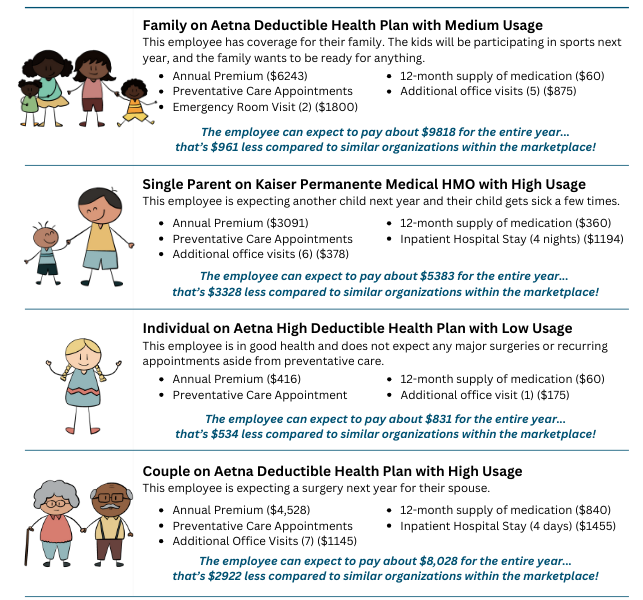


Swipe left/right (or click the left/right arrows) through the slides above to see how the Port offers better value than employers with similar plans.
Providing high quality medical, dental, and vision coverage that is “better than market” is one way the Port of Seattle supports its employees. As part of our overall healthcare strategy, employees pay a small share of the total cost of the premium for medical, dental and vision coverage while the Port pays the rest.
As good stewards of our finances we continue to invest heavily in our benefits, and we are always looking for ways to manage our costs wisely. Despite rising healthcare costs nationwide, the Port has strived to avoid passing more than slight increases onto employees for several years. While the Port covers most of the costs, we are continuing to share the costs with employees; balancing contributions and cost when care is received.
Each year, we measure specific aspects of our plans, including the premium sharing percentages, against the plans other employers in the Puget Sound region offer. The Port of Seattle’s goal is to be slightly better than market from a wholistic perspective with the market defined as the average of what other Puget Sound region employers offer based on the annual Milliman Northwest Benefits Survey.
Better Than Market
Picking a healthcare plan can be like searching for a needle in a haystack. Don't worry, though – depending on how frequently you use healthcare services (usage¹), we've got some examples that will give you a clearer idea of how Port plans compare. Keep in mind that these examples are just for show and the claims, costs, and how they're processed may differ.
[+] Click to Expand Infographic
More Detail: Rate Comparison Tables
Browse the tables below to see line-by-line how individual components of each Port-sponsored healthcare plan compare to the market average. Cells highlighted in green show where we are equal to or better than what other employers are offering for similar plans. Note: Market data can vary year to year based on organization participation.
Aetna Deductible Plan |
The Market (2023) |
The Port (2024) |
| Individual Deductible | $574 | $600 |
| Family Deductible | $1,413 | $1,800 |
| Individual Out of Pocket Max | $2,646 | $2,400 |
| Family Out of Pocket Max | $6,121 | $7,200 |
| Individual Premium Share | 11% | 9% |
| Family Premium Share | 29% | 19% |
| Coinsurance | 20% | 20% |
| (Pharmacy) Generic | $11 | $5 |
| (Pharmacy) Brand - Preferred | $32 | $35 |
| (Pharmacy) Brand - Non Preferred | $65 | $50 |
| (Pharmacy) Brand - Specialty | $86 | $50 |
Aetna High Deductible Health Plan |
The Market (2023) |
The Port (2024) |
| Individual Deductible | $2,279 | $1,600 |
| Family Deductible | $4,558 | $3,200 |
| Individual Out of Pocket Max | $4,190 | $4,000 |
| Family Out of Pocket Max | $8,231 | $8,000 |
| Individual Premium Share | 10% | 4% |
| Family Premium Share | 28% | 9% |
| Coinsurance | 20% | 20% |
| (Pharmacy) Generic - Coinsurance | 20% | 20% |
| (Pharmacy) Brand - Preferred - Coinsurance | 20% | 20% |
| (Pharmacy) Brand - Specialty - Coinsurance | 20% | 20% |
Kaiser Permanente |
The Market (2023) | The Port (2024) |
| Individual Deductible | $250 | $0 |
| Family Deductible | $750 | $0 |
| Individual Out of Pocket Max | $2,000 | $1,500 |
| Family OOP Max | $4,750 | $3,000 |
| Individual Premium Share | 11% | 9% |
| Family Premium Share | 28% | 19% |
| Coinsurance | 20% | 20% |
| (Pharmacy) Generic | $10 | $15 |
| (Pharmacy) Brand - Preferred | $25 | $30 |
| (Pharmacy) Brand - Non Preferred | $48 | n/a |
| (Pharmacy) Brand - Specialty | $30 | $30 |
Delta Dental (Core) |
The Market (2023) |
The Port (2024) |
| Deductible | $50 | $0 |
| Annual Maximum | $2,000 | $2,000 |
| Orthodontic Maximum | $1,797 | $0 |
| Individual Premium Share | 22% | 5% |
| Family Premium Share | 55% | 15% |
VSP Vision (Core) |
The Market (2023) |
The Port (2024) |
| Hardware Dollar Limit | $178 | $200 |
| Copay | $16 | $10 |
| Individual Premium Share | 35% | 17% |
| Family Premium Share | 57% | 27% |


